See how one walkthrough performs
Open a walkthrough's analytics to see its views, completion, and replays over time, and the steps where viewers stop and how long they spend on each.
Open a walkthrough's analytics
To open a walkthrough's analytics:
- Open the project. You'll see the walkthrough in preview. If the editor opens instead, select Preview.
- Select Analytics at the top. You'll see the project's Insights, on the Analytics tab.
- Optional: in the date menu, select Past week, Past month, or Past 12 months. It starts at Past week.
Analytics is available once the project finishes processing. The Leads tab beside Analytics lists the leads a form collected. You can also open a walkthrough's analytics from Recent projects in workspace Insights.
What each number means
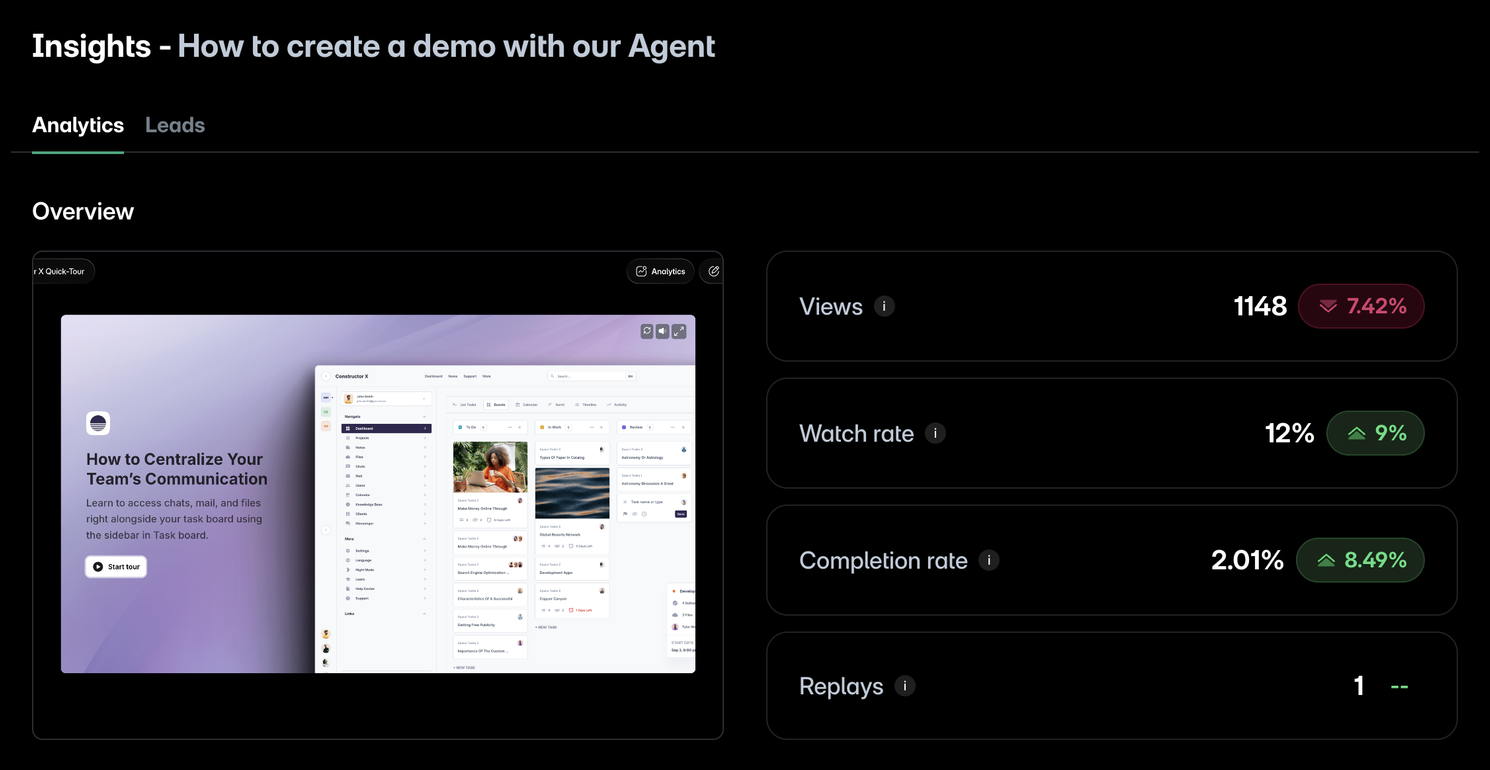
| Number | What it shows |
|---|---|
| Views | How many times the walkthrough was opened in the period, replays included. |
| Watch rate | How far viewers got on average, as a share of the walkthrough's steps. |
| Leads | Shown in place of Watch rate for some walkthroughs with a form: how many leads the form collected. |
| Completion rate | The share of visits that reached the last step. |
| Replays | How many times viewers replayed the walkthrough after finishing it. |
Beside each number, an arrow shows how much it went up or down compared with the period of the same length before it. A dash means there's nothing to compare with yet.
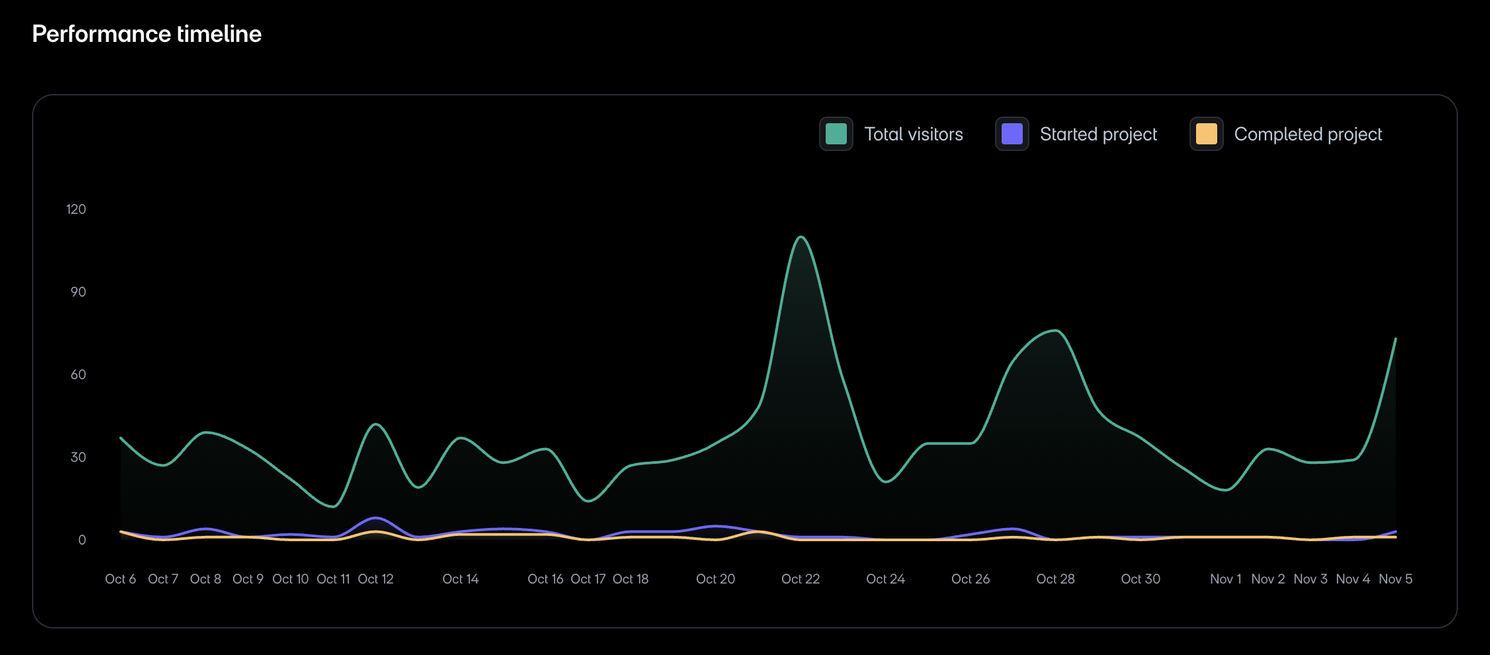
Performance timeline charts Total visitors, Started project, and Completed project over the period. Activity breaks down the period's visits by operating system, country, browser, and device. Select the expand icon on a card to see its full list.
See where viewers drop off
Steps view rate has a bar for each step: the share of viewers on that step who went on to the next one. Hover over a step to see its Conversion, its Drop-off, which is the share who stopped there, and the Average time spent here in seconds.
The shortest bars show where most viewers stop. The hover card also shows the step's screen, so you can see which one it is. The last step has no bar, since there's no step after it. When the walkthrough has no views in the period, the chart says "No visitors have viewed this tour yet".
Limits
- Step data covers visits from September 2025 on.
- Visits to the walkthrough's share link and its embeds count.
- When you open a walkthrough you created at its layerpath.com share link, signed in to Layerpath in the same browser, your visit isn't recorded. Other members' visits count like anyone else's.
- Nothing is recorded when a walkthrough plays inside Layerpath, such as in Preview.
- The Analytics tab has no export. To download the leads a form collected, use the Leads tab.